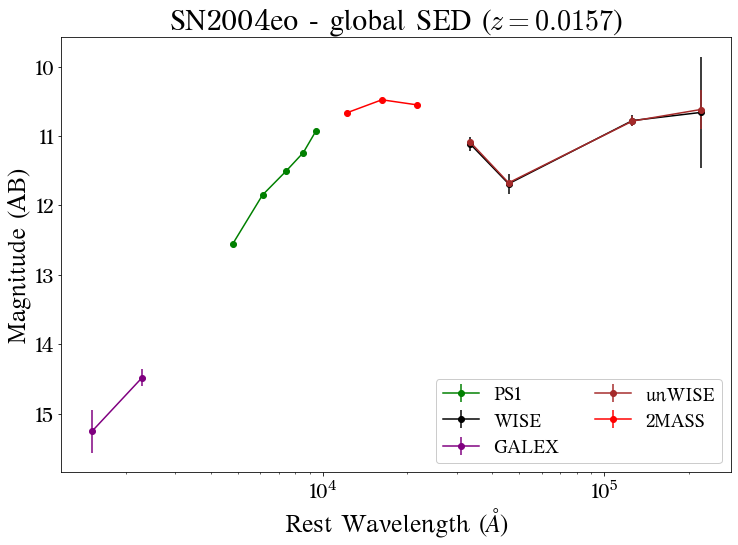
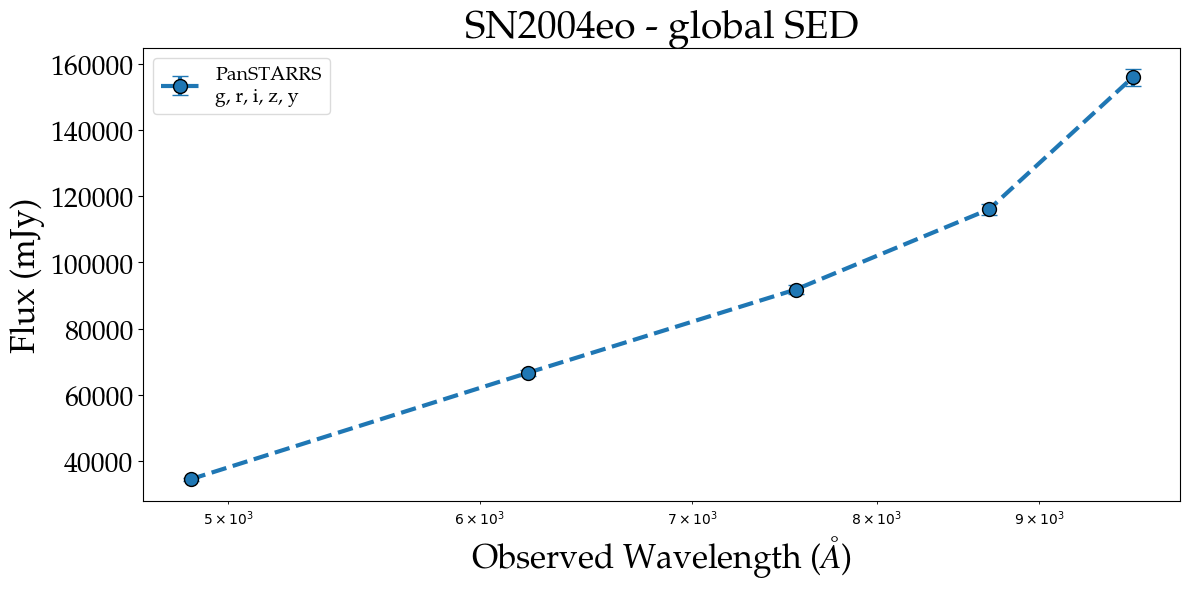
SED Plotting
With HostPhot, the user can plot the SED from the calculated photometry.
[1]:
import hostphot
print('HostPhot version:', hostphot.__version__)
HostPhot version: 3.0.0
[2]:
from hostphot.photometry.sed_plotting import plot_sed

plot_sed("SN2004eo", phot_type="global")
[3]:
plot_sed("SN2004eo", phot_type="global", plot_flux=True)
[ ]: